source(here::here("common.R"))
scores_raw <- load_levante_scores()
trials_swr <- load_levante_trials(task_ids = "swr")00 — Load data (per-site processed datasets, 2026-08-31 draft snapshot)
ImportantAI-generated — not for publication
The code and prose in this chapter were written by Claude Code (an AI coding agent) under human direction. They have not been line-by-line verified by a human and must not be published or cited as-is.
WarningPreliminary & unvetted analysis
These are exploratory analyses of preliminary, in-progress LEVANTE data. Results have not been reviewed or validated and require checking by the LEVANTE Data Coordinating Center before any use.
Purpose
This notebook is the entry point for the LEVANTE longitudinal analysis project. It downloads the scores data from Redivis, caches it locally, attaches LEVANTE-standard labels and palettes, and then summarizes:
- which sites have data (and how much),
- which tasks are covered at each site/dataset,
- age distributions,
- longitudinal coverage (how many children have repeat assessments).
Data source (2026-08-31 update, presentation snapshot). The unified levante_data_latest dataset is still at v1_2 (June); the loaders bind the per-site processed datasets directly, and this snapshot pulls each dataset’s unreleased “next” draft — the absolute newest processed data (common.R::levante_site_specs; the cached rds is the reproducibility anchor since drafts are mutable; provenance in data/scores_sites_2026-08-31_meta.csv). Relative to the June release this adds, cumulatively: rural Colombia’s second wave (repeat child×task pairs 32 → 1,239; ~9.6-month gap, led by ROAR + Math); Leipzig’s third wave, which began arriving 2026-08-29 — 39 children re-tested on the full battery through Aug 30, already scored in the draft (167 three-wave child×task cells, the project’s first); Argentina (UTDT main) coming online at scale — 788 children, 12 tasks, ages 4.8–8.4 (es-AR); Western’s June–August backlog entering processing (+863 scored rows vs the 08-24 snapshot — doubling Western’s longitudinal sample to 263 repeat pairs / 46 children); Sheffield more than tripling (755 rows); and Boston’s downward extension growing to 42 children (chapter 10). The per-site scores are all under the updated (registry v2_3) scoring models. Cape Coast and Sheffield intl-YS still have no scored rows. Note: trial-level pulls (and therefore the ROAR-Word engagement filter) remain at the 08-24 released versions — the filter does not yet cover the newest runs.
Sanity check: row counts per site / dataset.
scores_raw |>
  count(site_label, dataset_label, name = "n_rows") |>
  arrange(desc(n_rows)) |>
knitr::kable()| site_label | dataset_label | n_rows |
|---|---|---|
| Colombia | Colombia — Caquetá/Boyacá | 9311 |
| Colombia | Colombia — Bogotá | 8388 |
| Germany (MPI EVA Leipzig) | Germany — Leipzig | 6190 |
| Canada (Western) | Canada — Ontario | 5043 |
| Argentina (UTDT) | Argentina — UTDT (main) | 3194 |
| UK (Sheffield) | UK — Sheffield | 842 |
| Germany (MPIB Berlin) | Germany — Berlin (MPIB) | 788 |
| Argentina (UTDT, RfP1 YS) | Argentina — UTDT (RfP1 YS) | 750 |
| US (Sparklab, downext) | US — Sparklab (downext) | 621 |
| Germany (MPIB, RfP1 YS) | Germany — MPIB (RfP1 YS) | 485 |
| US (Boston, downext) | US — Boston Children’s (downext) | 378 |
| US (LangCog, downext) | US — LangCog (downext) | 102 |
Cleaning
Two cleaning steps are applied here so that they propagate consistently through 02 / 03 / tasks/ notebooks. See the “Known data issues” section at the bottom of this notebook for the full justification.
# New in the 2026-08 per-site processing: an `exclusion` column marks runs the
# pipeline could not score (no_data / incomplete / few_valid_trials /
# duplicate). These rows carry no score; dropping them is what un-inflates the
# handful of rural kids that otherwise show 8-10 "runs" of one task.
basic_cleaned <- scores_raw |>
  filter(is.na(exclusion)) |>
  filter(!is.na(age), age >= 2, age <= 14) |>
  filter(is.na(score) | (score > -8 & score < 8))

cleaned <- clean_levante_scores(basic_cleaned, trials_swr)
scores  <- cleaned$scores

cleaned$report |> knitr::kable(caption = "Cleaning report")| step | n |
|---|---|
| adaptive_na_backfilled | 18 |
| roar_word_runs_dropped | 41 |
glue("Kept {nrow(scores)} of {nrow(scores_raw)} score rows (raw → cleaned).")Kept 28553 of 36092 score rows (raw → cleaned).Inventory by site / dataset
site_summary <- scores |>
  group_by(site_label, dataset_label) |>
  summarise(
    n_children = n_distinct(user_id),
    n_runs     = n_distinct(run_id),
    n_tasks    = n_distinct(task_id),
    n_rows     = n(),
    age_min    = min(age, na.rm = TRUE),
    age_max    = max(age, na.rm = TRUE),
    .groups    = "drop"
  ) |>
  arrange(desc(n_children))

knitr::kable(site_summary, digits = 1)| site_label | dataset_label | n_children | n_runs | n_tasks | n_rows | age_min | age_max |
|---|---|---|---|---|---|---|---|
| Colombia | Colombia — Caquetá/Boyacá | 935 | 8054 | 12 | 8054 | 4.6 | 14.0 |
| Argentina (UTDT) | Argentina — UTDT (main) | 788 | 3051 | 12 | 3051 | 4.8 | 8.4 |
| Colombia | Colombia — Bogotá | 653 | 5742 | 12 | 5742 | 4.9 | 14.0 |
| US (Sparklab, downext) | US — Sparklab (downext) | 478 | 490 | 1 | 490 | 3.4 | 4.9 |
| Canada (Western) | Canada — Ontario | 377 | 3571 | 12 | 3571 | 5.0 | 13.9 |
| Germany (MPI EVA Leipzig) | Germany — Leipzig | 351 | 5049 | 11 | 5049 | 5.1 | 13.8 |
| Argentina (UTDT, RfP1 YS) | Argentina — UTDT (RfP1 YS) | 218 | 429 | 2 | 429 | 4.8 | 6.3 |
| Germany (MPIB Berlin) | Germany — Berlin (MPIB) | 192 | 686 | 4 | 686 | 6.1 | 8.8 |
| Germany (MPIB, RfP1 YS) | Germany — MPIB (RfP1 YS) | 82 | 432 | 6 | 432 | 4.5 | 8.4 |
| UK (Sheffield) | UK — Sheffield | 76 | 755 | 12 | 755 | 6.0 | 10.0 |
| US (Boston, downext) | US — Boston Children’s (downext) | 42 | 249 | 9 | 249 | 2.0 | 5.9 |
| US (LangCog, downext) | US — LangCog (downext) | 39 | 45 | 6 | 45 | 3.1 | 5.8 |
site_summary |>
  mutate(dataset_label = fct_reorder(dataset_label, n_children)) |>
  ggplot(aes(x = dataset_label, y = n_children, fill = site_label)) +
  geom_col() +
  geom_text(aes(label = n_children), hjust = -0.1, size = 3) +
  coord_flip() +
  scale_fill_site(name = NULL) +
  labs(x = NULL, y = "Children with at least one scored task",
       title = "Sample size by dataset") +
  expand_limits(y = max(site_summary$n_children) * 1.1) +
  theme(legend.position = "bottom")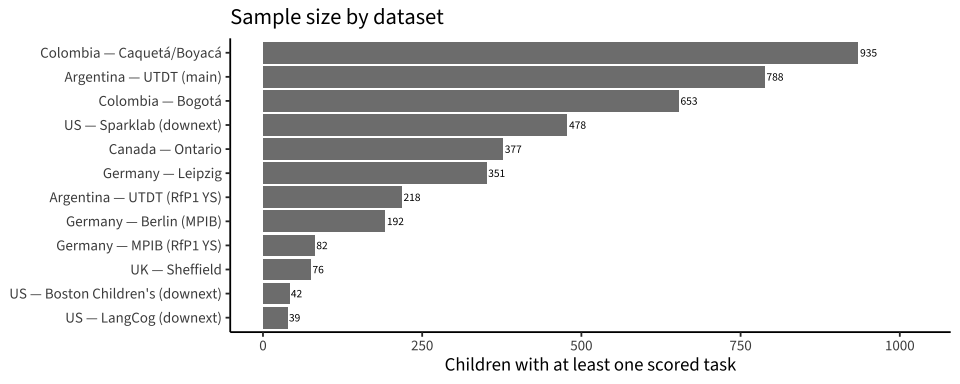
Age distribution per dataset
scores |>
  distinct(site_label, dataset_label, user_id, age) |>
  ggplot(aes(x = age, fill = site_label)) +
  geom_histogram(binwidth = 0.5, color = "white") +
  facet_wrap(~dataset_label, scales = "free_y") +
  scale_fill_site(guide = "none") +
  scale_y_continuous(expand = expansion(0, 0)) +
  labs(x = "Age (years)", y = "Number of children",
       title = "Age distribution per dataset")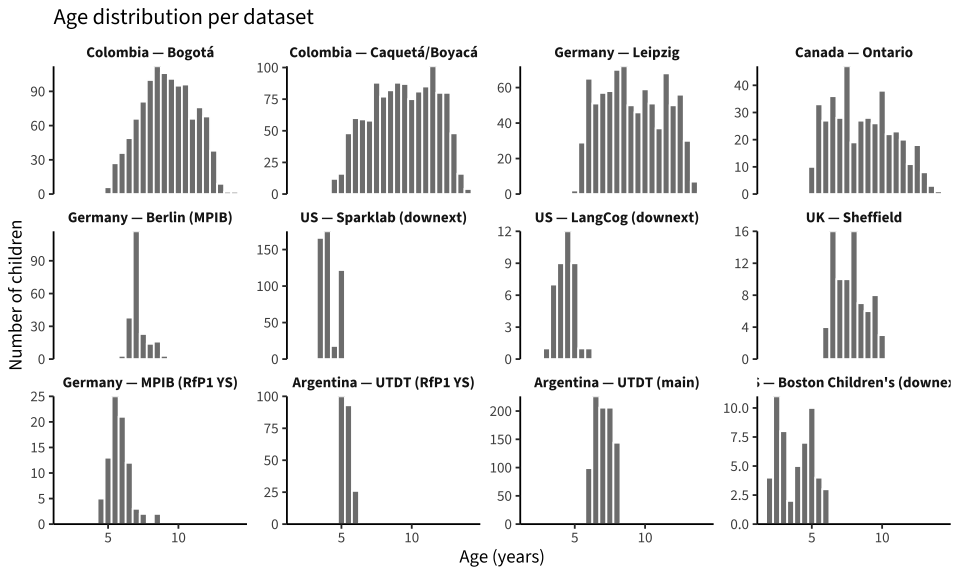
Task × dataset coverage
Which tasks are present at which dataset? Cell value = number of scored runs; empty cells mean no data.
scores |>
  count(dataset_label, task_label, task_category, name = "n_runs") |>
  ggplot(aes(x = task_label, y = dataset_label, fill = task_category)) +
  geom_tile(color = "white") +
  geom_text(aes(label = n_runs), size = 3) +
  scale_fill_task(guide = "none") +
  facet_grid(. ~ task_category, scales = "free_x", space = "free_x") +
  labs(x = NULL, y = NULL,
       title = "Task × dataset coverage (cell = number of scored runs)") +
  theme(axis.text.x = element_text(angle = 45, hjust = 1),
        panel.spacing = unit(0.1, "lines"))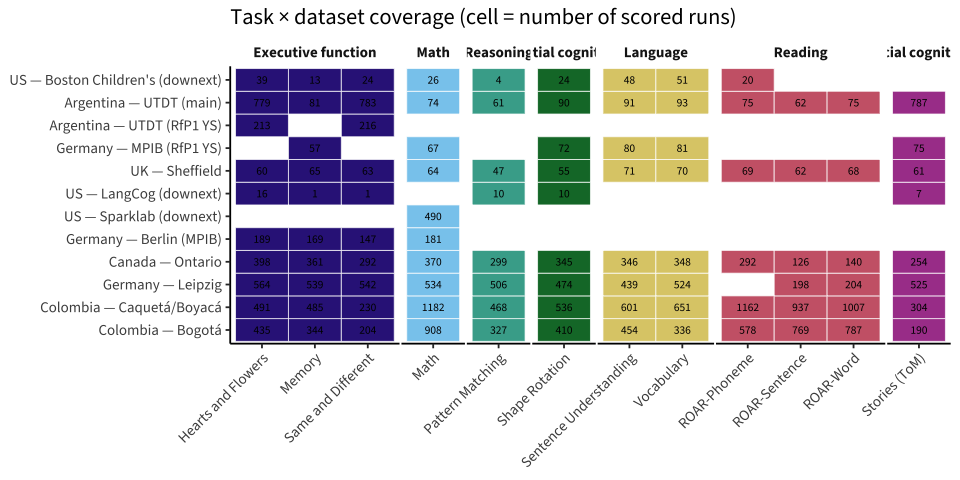
Longitudinal coverage
LEVANTE’s design targets ≥ 3 timepoints per child. Here a “timepoint” = distinct run_id within a user_id × task_id. The question: how much repeat data do we actually have?
repeats_task <- scores |>
  group_by(dataset_label, user_id, task_id, task_label, task_category) |>
  summarise(n_runs = n_distinct(run_id),
            age_span = diff(range(age, na.rm = TRUE)),
            .groups = "drop")

repeats_task |>
  count(dataset_label, n_runs, name = "n_child_task") |>
  ggplot(aes(x = factor(n_runs), y = n_child_task, fill = dataset_label)) +
  geom_col() +
  facet_wrap(~dataset_label, scales = "free_y") +
  scale_fill_brewer(palette = "Set2", guide = "none") +
  labs(x = "Times a (child, task) pair was administered",
       y = "Count of (child, task) pairs",
       title = "Per-(child, task) repeat-administration counts")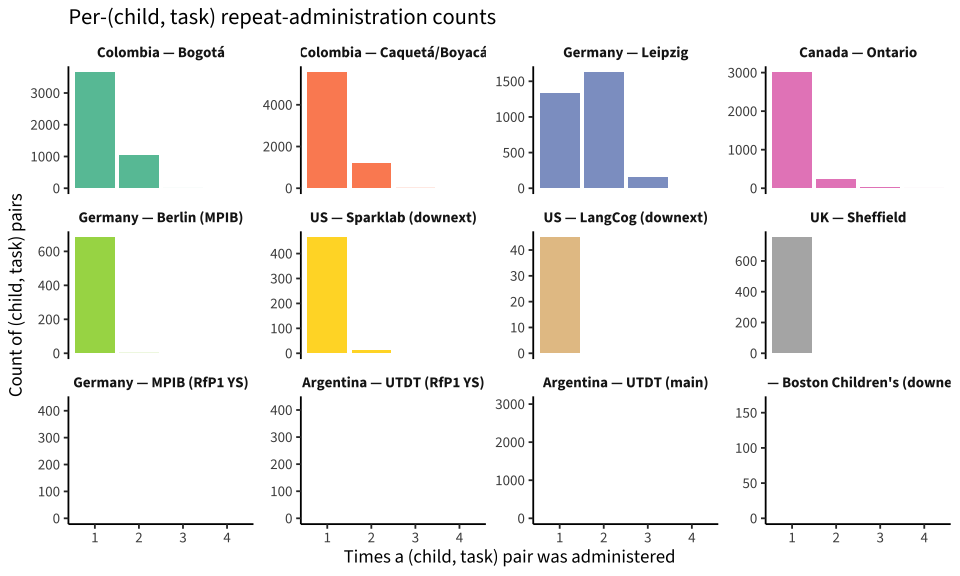
scores |>
  group_by(dataset_label, user_id, task_id) |>
  summarise(n_runs = n_distinct(run_id),
            age_gap_m = diff(range(age, na.rm = TRUE)) * 12,
            .groups = "drop") |>
  filter(n_runs > 1) |>
  group_by(dataset_label) |>
  summarise(
    n_repeat_pairs        = n(),
    n_kids_with_any_repeat = n_distinct(user_id),
    median_gap_m          = median(age_gap_m),
    max_gap_m             = max(age_gap_m),
    .groups = "drop"
  ) |>
  arrange(desc(n_repeat_pairs)) |>
  knitr::kable(digits = 1,
               col.names = c("Dataset", "Repeat (child, task) pairs",
                             "Kids with any repeat",
"Median gap (mo)", "Max gap (mo)"))| Dataset | Repeat (child, task) pairs | Kids with any repeat | Median gap (mo) | Max gap (mo) |
|---|---|---|---|---|
| Germany — Leipzig | 1780 | 228 | 3.6 | 24.0 |
| Colombia — Caquetá/Boyacá | 1239 | 321 | 9.6 | 10.8 |
| Colombia — Bogotá | 1041 | 464 | 15.6 | 16.8 |
| Canada — Ontario | 263 | 46 | 12.0 | 15.6 |
| US — Boston Children’s (downext) | 42 | 14 | 1.2 | 1.2 |
| US — Sparklab (downext) | 12 | 12 | 0.0 | 1.2 |
| Germany — Berlin (MPIB) | 1 | 1 | 0.0 | 0.0 |
Score-by-age at a glance
Cross-sectional age gradient by task and site. This is intentionally a quick-look plot — 01 fits proper longitudinal models.
scores |>
  filter(!is.na(score), task_id %in% core_task_ids) |>
  levante_age_score_plot()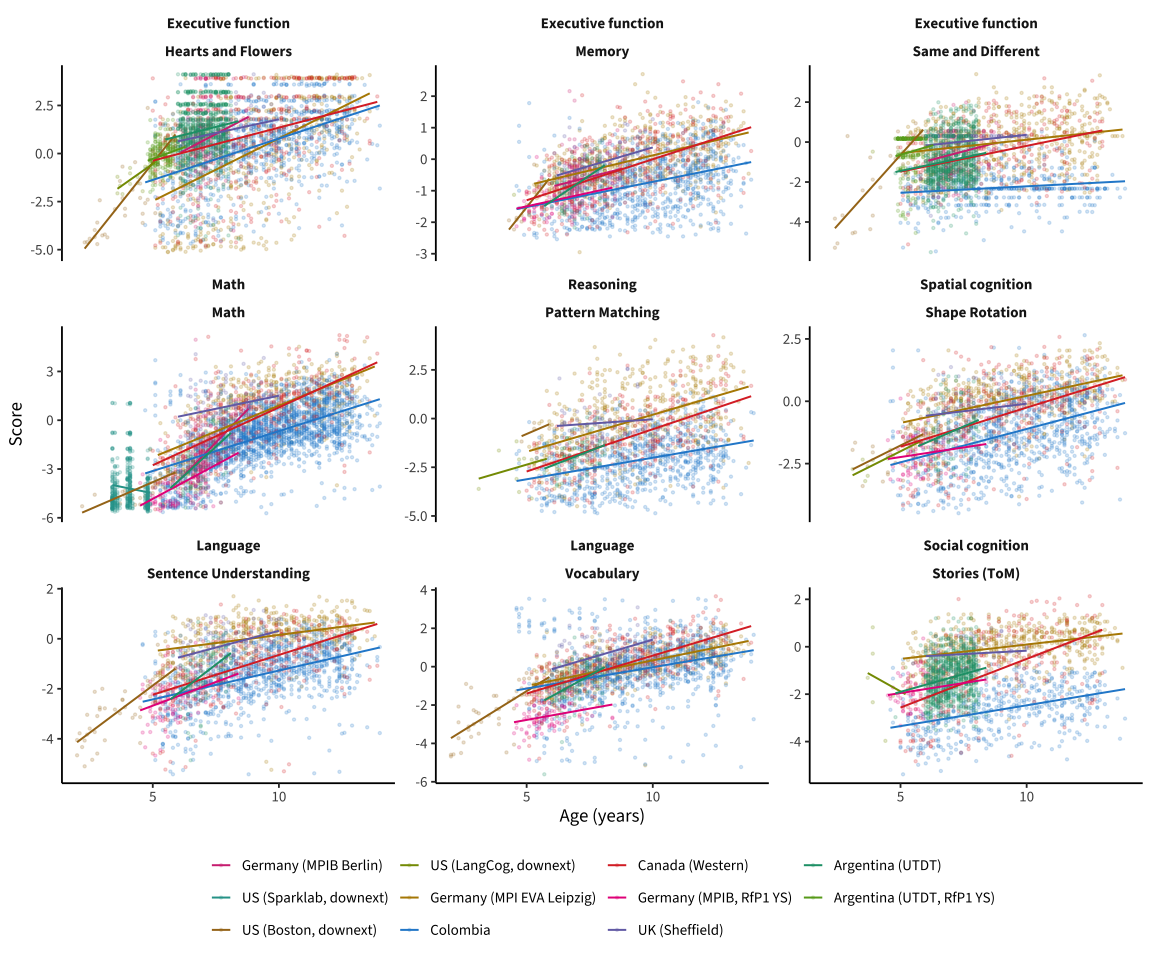
Save
We persist two artifacts for downstream notebooks:
data/scores_raw.rds— the rawlevante_data_latestpull, used by01_data_integrity.qmdso that the audit reflects what the data look like before we apply project-level fixes.data/scores_all_sites.rds— the cleaned tibble. This is the canonical scores table used by 02, 03, and thetasks/notebooks. Cleaning decisions are described in Known data issues below.
write_rds(scores_raw, here("data", "scores_raw.rds"))
write_rds(scores,     here("data", "scores_all_sites.rds"))
write_rds(site_summary, here("data", "site_summary.rds"))
write_rds(cleaned$roar_drops, here("data", "roar_word_dropped_runs.rds"))

glue("Saved {nrow(scores)} cleaned score rows ({nrow(scores_raw)} raw) from {nrow(site_summary)} datasets to data/.")
Saved 28553 cleaned score rows (36092 raw) from 12 datasets to data/.Known data issues
2026-08 data-update notes (per-site processed datasets)
New issues observed in the per-site processing that the loaders / cleaning handle, plus one substantive change to be aware of:
- Re-scored with updated models (registry v2_3 vs June’s v1_14) — an intentional, across-the-board scoring-model update (confirmed by the DCC). On overlapping runs, new-vs-old scores correlate r ≥ 0.99 for most tasks but r = 0.88 for Theory of Mind and r = 0.94 for Hearts & Flowers (max per-run |Δθ| up to ~3 logits) — the largest shifts, plausibly including the ToM item-identity repairs documented in
tasks/tom_reality_check_bug. Task-level ToM conclusions from June (thetasks/ToM chapters) predate the re-scoring and should be re-checked before being quoted. - ToM placeholder rows: every theory-of-mind run carries an all-NA duplicate row;
load_levante_scores_sites()drops them (912 rows). siteis NA in the newest processing for rural, Sheffield, and Boston; backfilled fromlevante_site_specs.exclusioncolumn replaces silent row absence for unscoreable runs (dropped in cleaning above; 1,167 rows).- The per-site scores tables now carry
time_started/time_finishedfor recently-processed datasets (rural, Sheffield, Boston) but not yet for the older ones.
Now on levante_data_latest v1.2 (corrected). The major IRT column-order scoring bug we found (see reports/rlevante_handoff.md) has been fixed in levantemodels and the data re-released; we verified v1.2 published scores match our independent corrected scoring (r = 1.000). This section logs the remaining issues and how each is handled: (a) fixed here (cleaning applied in this notebook), (b) resolved upstream (fixed in the v1.2 release), and (c) flagged only (the right fix lives elsewhere — scoring pipeline or validator).
Resolved upstream (v1.2)
0. IRT column-order scoring bug (FIXED). levantemodels::score_irt did not reorder response columns to the model’s item order before mirt::fscores, which matches by position — so IRT-scored tasks were mis-scored, worst for CAT and guessing-floor items. This drove most of what we had attributed to “CAT-vs-non-CAT step shifts”: after the fix, the Leipzig non-adaptive-minus- adaptive mean shift dropped from +2.4 → +0.30 (Math) and +1.1 → +0.10 (Vocab), and apparent longitudinal declines became sensible positive growth. Full writeup and validation: reports/rlevante_handoff.md, tasks/math_eap_vs_ml.html, tasks/vocab.html.
For deep-dive details see:
01_data_integrity.html— per-(site, task) audit.reports/adaptive_missingness.html— short DCC-team report on theadaptiveflag.tasks/roar_word.html— trial-level investigation of ROAR-Word floor scores.tasks/math.html— trial-level investigation of the Bogotá math “RTM.”
Fixed here
1. adaptive flag missing (235 runs in v1.2; was 196 in v1.0). Still concentrated in early-beta task_versions of Bogotá Memory and Leipzig/Western Math. The trial table shows zero theta_estimate writes for any of these runs, consistent with non-adaptive administration. Confirmed with the LEVANTE DCC: all were non-adaptive. (Not yet fixed upstream in v1.2.)
Fix applied: common.R::backfill_adaptive_na() sets adaptive = FALSE on these rows during cleaning.
2. ROAR-Word non-engagement. A small subset of ROAR-Word runs show trial-level accuracy below chance (40%) and/or median RT under 500 ms (faster than plausible word reading). These produce IRT score floors at θ = −6 with SE = 37 and are not informative. They are distinct from genuine non-readers (who attempt items at chance with normal RTs and also floor — those are kept).
Fix applied: common.R::roar_word_engagement_drops() drops runs with pct_correct < 0.4 OR median_rt_ms < 500. The dropped run-ids and the reason for each are saved to data/roar_word_dropped_runs.rds for downstream traceability.
Flagged only — not corrected in this repo
These deserve attention at the data-coordinating-center / scoring-pipeline level rather than in analysis code.
3. Residual CAT-vs-non-CAT differences (much reduced in v1.2). With the scoring bug fixed (#0), the dramatic mode shifts are gone — residual non-adaptive-minus-adaptive mean shifts are now all < 0.75 logits (Leipzig Math +0.30, Vocab +0.10; the largest is Leipzig Pattern Matching +0.73). What remains is plausibly genuine: mild ceiling on the easy non-adaptive forms plus EAP shrinkage — short CAT sessions carry less information, so EAP pulls them slightly harder toward the group mean, which can look like mild regression to the mean across a mode boundary. This is a small effect and a known property of EAP (see the EAP-vs-WLE discussion); not a bug. Every two-wave Bogotá math kid is still non-adaptive at T1 → CAT at T2, so interpret those θ deltas with the residual shrinkage in mind.
4. Memory task scoring — RESOLVED (2026-08). The release-notes concern (grid size 2×2 vs 3×3) is handled: grid is a calibrated item dimension, and the Leipzig wave-1→2 grid switch shows continuous within-child θ while raw sumscores break across grids (tasks/memory §4). 01 now marks Memory OK; the operational rule is use θ, never cross-grid sumscores.
5. Same & Different scoring — RESOLVED (2026-08). The corrected scoring landed in the registry v2_3 re-scoring and is final per the DCC. 01 upgrades SDS to OK (OK-mode at Bogotá, which still has no T2).
6. Pattern Matching / Sentence Understanding training effects. Both show systematic T2 > T1 within mode-stable subsets per the release notes. We can’t distinguish training from developmental change with two waves.
7. Bogotá T2 ROAR assignment is mutually exclusive. At T2, individual kids in Bogotá were assigned either swr or sre or pa — almost never two of them. Pairwise (swr, sre) overlap at T2 = 1 child (vs 584 at T1). This breaks any multi-indicator Language LGC that uses more than one ROAR task at Bogotá T2. 03 falls back to a swr + trog two-indicator LGC with metric invariance, which is identified.
Notes
- The bogota and rural Colombia samples share
site = pilot_uniandes_cobut stay separable viadataset. We carry both labels (site_label,dataset_label) downstream. - Data come from the per-site processed datasets pinned in
common.R::levante_site_specs(snapshot 2026-08-24) — update the specs and the snapshot constant when new versions land, or passversion = "v1_2"to the loaders to reproduce the June unified pull. - Compare what we see here to https://levante-framework.github.io/levante-datapage/ as a sanity check on the inventory.