source(here::here("common.R"))

scores <- read_rds(here::here("data", "scores_all_sites.rds"))
trials <- load_levante_trials(task_ids = "egma-math")
ip     <- load_item_parameters()

ipm <- ip |>
  filter(task_id == "egma-math", subset == "all_items",
         itemtype == "rasch", model_set == "multigroup_site") |>
mutate(item_group = str_extract(item_uid, "(?<=math_)[^_]+"))Math — item calibration & re-scoring diagnostics
ImportantAI-generated — not for publication
The code and prose in this chapter were written by Claude Code (an AI coding agent) under human direction. They have not been line-by-line verified by a human and must not be published or cited as-is.
WarningPreliminary & unvetted analysis
These are exploratory analyses of preliminary, in-progress LEVANTE data. Results have not been reviewed or validated and require checking by the LEVANTE Data Coordinating Center before any use.
Purpose
tasks/math.qmd showed that the Bogotá math T1→T2 “regression to the mean” is the CAT routing high-T1 kids onto number-line items they hadn’t been tested on at T1. Two questions remain:
- Why does the CAT serve so many line items to high-θ kids? Bank composition? Information-maximization? A bug?
- Why does that depress the IRT score? In principle a properly calibrated Rasch model handles asymmetric item provisioning across modes — every kid should land on the same θ scale regardless of which items they saw. So why doesn’t it?
We answer (1) using the item-parameter table from levante_metadata_scoring. We answer (2) by computing per-kid Rasch MLE ability estimates from the items each child actually saw, and comparing those to the pipeline-reported scores.
1. Item bank: where do line items sit?
ig_order <- ipm |>
  group_by(item_group) |>
  summarise(med = median(difficulty), .groups = "drop") |>
  arrange(med) |> pull(item_group)

ipm |>
  mutate(item_group = factor(item_group, levels = ig_order)) |>
  ggplot(aes(x = item_group, y = difficulty, color = item_group)) +
  geom_jitter(width = 0.2, alpha = 0.5) +
  geom_boxplot(outlier.shape = NA, alpha = 0.1, color = "black") +
  geom_hline(yintercept = 0, lty = 3, color = "grey50") +
  scale_color_brewer(palette = "Spectral", guide = "none") +
  labs(x = NULL, y = "Item difficulty (β)",
       title = "Math item difficulty by item_group",
       subtitle = "Rasch multigroup_site / scalar invariance calibration") +
  theme(axis.text.x = element_text(angle = 45, hjust = 1))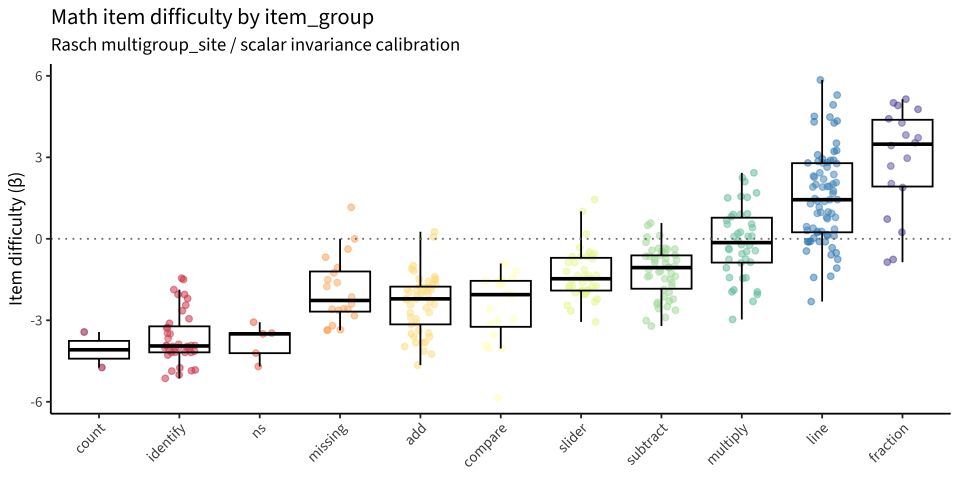
ipm |>
  group_by(item_group) |>
  summarise(
    n_items       = n(),
    median_diff   = median(difficulty),
    p10_diff      = quantile(difficulty, 0.1),
    p90_diff      = quantile(difficulty, 0.9),
    max_diff      = max(difficulty),
    median_n_resp = median(n_responses)
  ) |>
  arrange(median_diff) |>
knitr::kable(digits = 2)| item_group | n_items | median_diff | p10_diff | p90_diff | max_diff | median_n_resp |
|---|---|---|---|---|---|---|
| count | 2 | -4.08 | -4.61 | -3.56 | -3.43 | 87.0 |
| identify | 40 | -3.95 | -4.83 | -2.05 | -1.45 | 628.5 |
| ns | 5 | -3.50 | -4.50 | -3.23 | -3.07 | 85.0 |
| missing | 20 | -2.27 | -3.35 | -0.34 | 1.16 | 819.5 |
| add | 49 | -2.21 | -3.83 | -1.36 | 0.26 | 593.0 |
| compare | 20 | -2.05 | -4.03 | -1.41 | -0.91 | 740.0 |
| slider | 39 | -1.47 | -2.24 | -0.46 | 1.45 | 289.0 |
| subtract | 50 | -1.06 | -2.51 | -0.33 | 0.58 | 244.5 |
| multiply | 42 | -0.14 | -1.94 | 1.56 | 2.43 | 64.5 |
| line | 74 | 1.44 | -0.41 | 4.05 | 5.85 | 83.5 |
| fraction | 18 | 3.49 | -0.06 | 4.94 | 5.14 | 19.0 |
The item bank skews monotonically: counting and identification at β ≈ −4, arithmetic in the middle, line items median β = +1.5, range up to +5.9, and fractions at β ≈ +3. Line items have median ~84 responses each in the calibration sample, vs ~600 for the easy items.
ipm |>
  mutate(diff_bin = cut(difficulty, breaks = c(-Inf, -3, -1, 1, 3, Inf),
                        labels = c("β<-3", "-3 to -1", "-1 to 1",
                                   "1 to 3", "β>3"))) |>
  count(diff_bin, item_group) |>
  ggplot(aes(x = diff_bin, y = n, fill = item_group)) +
  geom_col(position = "stack") +
  scale_fill_brewer(palette = "Spectral") +
  labs(x = "Difficulty band", y = "Items",
       fill = NULL,
       title = "Bank composition by difficulty band",
       subtitle = "Above β=1 the bank is mostly line and fraction items") +
  theme(legend.position = "right")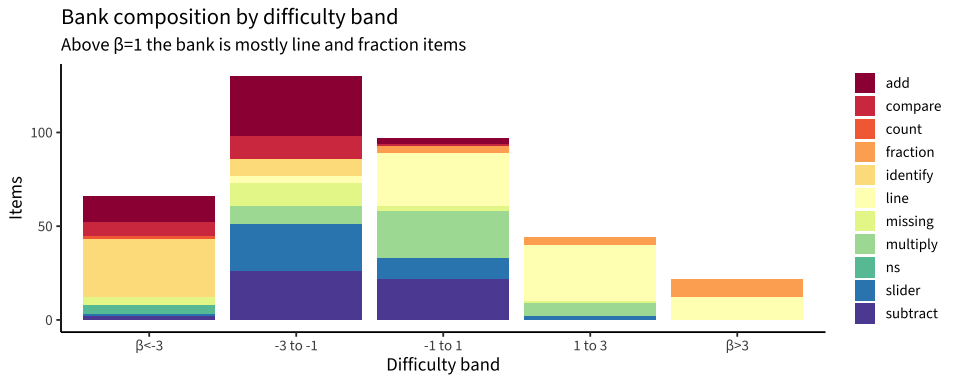
So when the CAT estimates a kid at θ ≈ +1 or higher, the items that maximize Fisher information at that θ are predominantly line items. This is mechanical: max-info items at θ are those with β ≈ θ, and the only items with β > 1 are line/fraction.
2. Join item parameters into the trial data
math_trials <- trials |>
  filter(task_id == "egma-math") |>
  left_join(ipm |> select(item_uid, beta = difficulty,
                          item_group_ip = item_group),
            by = "item_uid")

cat("Math trials with item β attached:",
    sum(!is.na(math_trials$beta)), "/", nrow(math_trials), "\n")
Math trials with item β attached: 183332 / 189370 cat("Distinct items in trials but missing β:",
n_distinct(math_trials$item_uid[is.na(math_trials$beta)]), "\n")Distinct items in trials but missing β: 28 math_trials |>
filter(is.na(beta)) |>
count(item_uid, name = "n_trials") |>
arrange(desc(n_trials)) |>
head(10) |>
knitr::kable(caption = "Top items in trials but missing from item_parameters")| item_uid | n_trials |
|---|---|
| math_compare_10_12 | 543 |
| math_add_2_2 | 533 |
| math_ns_identify_2 | 457 |
| math_identify_3 | 456 |
| math_count_1 | 451 |
| math_ns_count_7 | 451 |
| math_count_4 | 450 |
| math_ns_count_5 | 450 |
| math_ns_count_3 | 449 |
| math_ns_compare_7_4 | 436 |
3. Bogotá two-wave sample
math_bog <- scores |>
  filter(dataset == "pilot_uniandes_co_bogota", task_id == "egma-math") |>
  group_by(user_id) |> arrange(age) |>
  mutate(wave = row_number()) |> ungroup() |>
  filter(wave <= 2)

pairs <- math_bog |>
  group_by(user_id) |>
  filter(n_distinct(wave) == 2) |>
  summarise(score_t1 = score[wave == 1], score_t2 = score[wave == 2],
            run_id_t1 = run_id[wave == 1], run_id_t2 = run_id[wave == 2],
            .groups = "drop") |>
  mutate(t1_quartile = ntile(score_t1, 4))

cat("Two-wave Bogotá math kids:", nrow(pairs), "\n")
Two-wave Bogotá math kids: 234 4. For high-T1 kids: did the CAT actually route them to harder items?
twq <- bind_rows(
  math_trials |> filter(dataset == "pilot_uniandes_co_bogota",
                         run_id %in% pairs$run_id_t1) |>
    mutate(wave = "T1") |>
    inner_join(pairs |> select(run_id = run_id_t1, t1_quartile),
               by = "run_id"),
  math_trials |> filter(dataset == "pilot_uniandes_co_bogota",
                         run_id %in% pairs$run_id_t2) |>
    mutate(wave = "T2") |>
    inner_join(pairs |> select(run_id = run_id_t2, t1_quartile),
               by = "run_id")
)

twq |>
  filter(!is.na(beta)) |>
  ggplot(aes(x = factor(t1_quartile), y = beta, fill = wave)) +
  geom_violin(alpha = 0.7, color = NA) +
  geom_boxplot(width = 0.15, position = position_dodge(0.9),
               outlier.shape = NA, alpha = 0.4) +
  scale_fill_manual(values = c(T1 = "#268bd2", T2 = "#d33682")) +
  labs(x = "T1 quartile", y = "Item difficulty β",
       fill = NULL,
       title = "Item difficulty seen by wave × T1 quartile",
       subtitle = "At T2 the CAT routes Q4 (high-T1) kids onto noticeably harder items")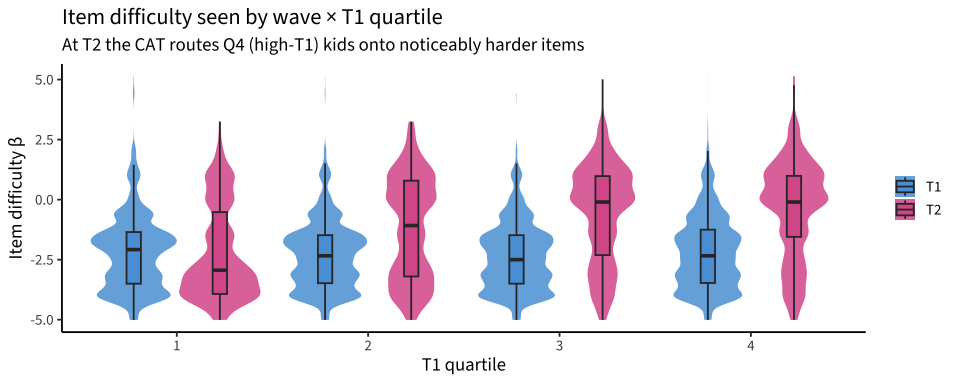
twq |>
  filter(!is.na(beta)) |>
  group_by(t1_quartile, wave) |>
  summarise(median_beta = median(beta),
            mean_beta   = mean(beta),
            n_trials    = n(),
            .groups = "drop") |>
  pivot_wider(names_from = wave, values_from = c(median_beta, mean_beta,
                                                  n_trials)) |>
knitr::kable(digits = 2)| t1_quartile | median_beta_T1 | median_beta_T2 | mean_beta_T1 | mean_beta_T2 | n_trials_T1 | n_trials_T2 |
|---|---|---|---|---|---|---|
| 1 | -2.08 | -2.94 | -2.21 | -2.23 | 4691 | 2490 |
| 2 | -2.34 | -1.08 | -2.31 | -1.20 | 5722 | 2364 |
| 3 | -2.50 | -0.10 | -2.37 | -0.56 | 5463 | 2370 |
| 4 | -2.34 | -0.10 | -2.19 | -0.40 | 6089 | 2436 |
5. The critical test: are kids correctly answering the harder items?
For Q4 (high-T1) kids at T2, what’s their accuracy at each β-band? If they’re genuinely at θ ≈ +2 (per T1 score), Rasch predicts ~73% correct on β=+1 items, ~50% on β=+2 items, ~27% on β=+3 items.
rasch_p <- function(theta, beta) 1 / (1 + exp(beta - theta))

q4_t2 <- twq |>
  filter(t1_quartile == 4, wave == "T2", !is.na(beta), !is.na(correct))

# Get each kid's reported T1 θ as their "true" ability for the prediction
q4_t2 <- q4_t2 |>
  inner_join(pairs |> select(user_id, score_t1), by = "user_id")

q4_t2 |>
  mutate(beta_bin = cut(beta, breaks = c(-Inf, -2, -1, 0, 1, 2, Inf))) |>
  group_by(beta_bin) |>
  summarise(
    n_trials   = n(),
    actual_acc = mean(correct, na.rm = TRUE),
    pred_acc   = mean(rasch_p(score_t1, beta), na.rm = TRUE),
    .groups    = "drop"
  ) |>
  pivot_longer(c(actual_acc, pred_acc)) |>
  ggplot(aes(x = beta_bin, y = value, fill = name)) +
  geom_col(position = "dodge") +
  scale_fill_manual(values = c(actual_acc = "#268bd2", pred_acc = "#cb4b16"),
                    labels = c("Observed", "Rasch prediction at T1 θ")) +
  scale_y_continuous(labels = scales::percent) +
  labs(x = "Item difficulty β at T2", y = "P(correct)",
       fill = NULL,
       title = "Q4 (high-T1) kids: observed vs predicted accuracy at T2",
       subtitle = "Prediction uses each kid's T1 θ as 'true' ability")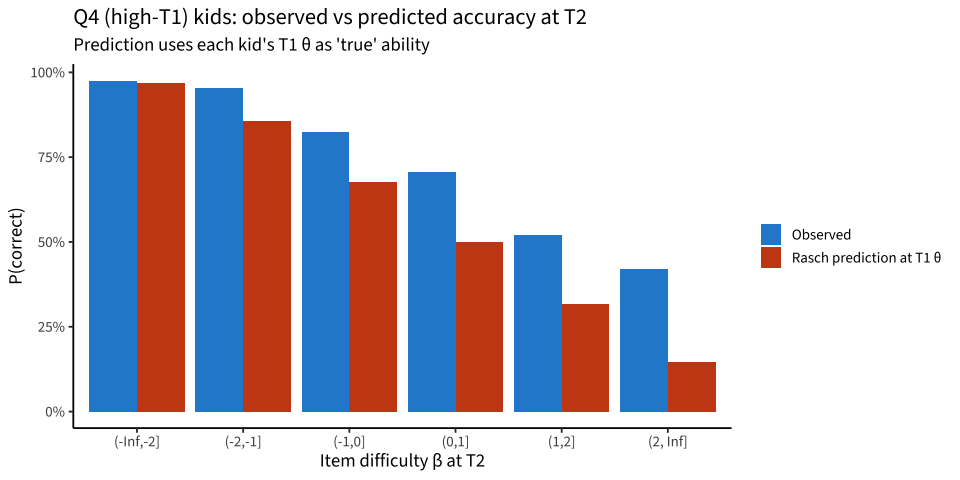
q4_t2 |>
  group_by(item_group_ip) |>
  filter(n() >= 30) |>
  summarise(
    n_trials   = n(),
    median_beta = median(beta),
    actual_acc = mean(correct, na.rm = TRUE),
    pred_acc   = mean(rasch_p(score_t1, beta), na.rm = TRUE),
    .groups    = "drop"
  ) |>
  mutate(gap = actual_acc - pred_acc) |>
  arrange(gap) |>
  knitr::kable(digits = 3,
caption = "Q4 kids at T2: observed - predicted accuracy by item_group")| item_group_ip | n_trials | median_beta | actual_acc | pred_acc | gap |
|---|---|---|---|---|---|
| identify | 290 | -3.96 | 0.986 | 0.984 | 0.002 |
| subtract | 67 | -0.88 | 0.821 | 0.782 | 0.039 |
| compare | 124 | -2.94 | 0.976 | 0.925 | 0.051 |
| add | 33 | -1.51 | 0.909 | 0.853 | 0.056 |
| missing | 168 | -2.57 | 0.935 | 0.863 | 0.071 |
| multiply | 99 | -0.86 | 0.869 | 0.768 | 0.101 |
| line | 1620 | 0.79 | 0.686 | 0.496 | 0.190 |
| fraction | 35 | 4.42 | 0.371 | 0.174 | 0.198 |
6. Same diagnostic for ALL quartiles, not just Q4
twq |>
  filter(wave == "T2", !is.na(beta), !is.na(correct)) |>
  inner_join(pairs |> select(user_id, score_t1), by = "user_id") |>
  mutate(beta_bin = cut(beta, breaks = c(-Inf, -2, -1, 0, 1, 2, Inf))) |>
  group_by(t1_quartile, beta_bin) |>
  filter(n() >= 20) |>
  summarise(
    actual_acc = mean(correct, na.rm = TRUE),
    pred_acc   = mean(rasch_p(score_t1, beta), na.rm = TRUE),
    n_trials   = n(),
    .groups    = "drop"
  ) |>
  pivot_longer(c(actual_acc, pred_acc)) |>
  ggplot(aes(x = beta_bin, y = value, fill = name)) +
  geom_col(position = "dodge") +
  facet_wrap(~t1_quartile, ncol = 4,
             labeller = labeller(t1_quartile = function(x) glue("Q{x}"))) +
  scale_fill_manual(values = c(actual_acc = "#268bd2", pred_acc = "#cb4b16"),
                    labels = c("Observed", "Rasch prediction at T1 θ")) +
  scale_y_continuous(labels = scales::percent) +
  labs(x = "Item difficulty β at T2", y = "P(correct)",
       fill = NULL,
       title = "Observed vs predicted accuracy at T2, by T1 quartile and β-band") +
  theme(axis.text.x = element_text(angle = 45, hjust = 1))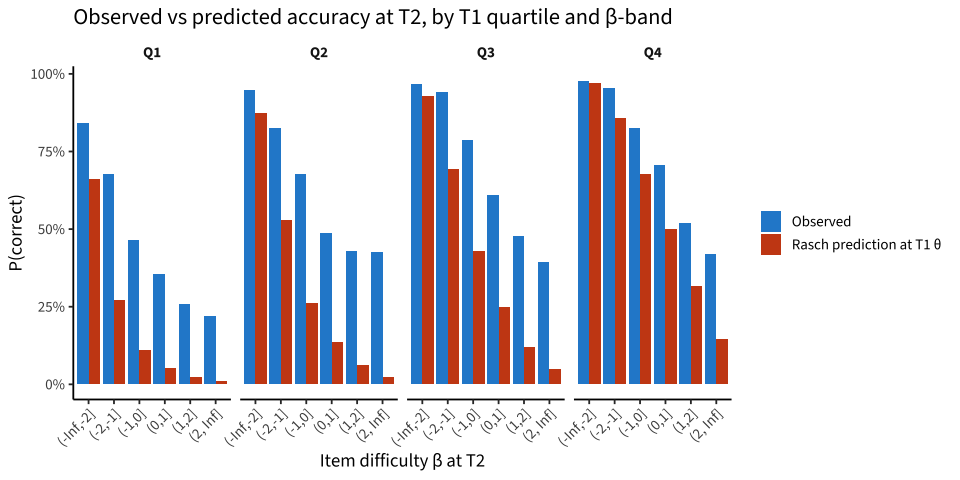
7. Simple Rasch MLE refit on items each kid saw
Compute each kid’s max-likelihood Rasch θ using only the items they actually saw (T1 and T2 separately). Compare to the pipeline-reported scores.
# Per-kid Rasch MLE: maximize sum log P(y_i | θ, β_i) where y_i in {0,1}.
# We use one-dim optim; bound θ to ±6.
rasch_mle <- function(beta, y) {
  ok <- !is.na(beta) & !is.na(y)
  beta <- beta[ok]; y <- as.integer(y[ok])
  if (length(beta) < 3) return(NA_real_)
  neg_ll <- function(theta) {
    p <- 1 / (1 + exp(beta - theta))
    p <- pmin(pmax(p, 1e-8), 1 - 1e-8)
    -sum(y * log(p) + (1 - y) * log(1 - p))
  }
  opt <- optimise(neg_ll, lower = -6, upper = 6)
  opt$minimum
}

run_mle <- bind_rows(
  math_trials |> filter(dataset == "pilot_uniandes_co_bogota",
                         run_id %in% pairs$run_id_t1) |>
    mutate(wave = "T1"),
  math_trials |> filter(dataset == "pilot_uniandes_co_bogota",
                         run_id %in% pairs$run_id_t2) |>
    mutate(wave = "T2")
) |>
  group_by(user_id, run_id, wave) |>
  summarise(
    n_items   = sum(!is.na(beta)),
    n_correct = sum(correct[!is.na(beta)], na.rm = TRUE),
    theta_mle = rasch_mle(beta, correct),
    .groups = "drop"
  )

# Attach pipeline scores
pipeline <- bind_rows(
  pairs |> transmute(user_id, wave = "T1", run_id = run_id_t1, score_pipeline = score_t1),
  pairs |> transmute(user_id, wave = "T2", run_id = run_id_t2, score_pipeline = score_t2)
)
compare <- run_mle |> inner_join(pipeline, by = c("user_id", "run_id", "wave"))

compare |> head(8) |> knitr::kable(digits = 2)| user_id | run_id | wave | n_items | n_correct | theta_mle | score_pipeline |
|---|---|---|---|---|---|---|
| 01TonkOE2dWerkUlJZOIDwJkQNG3 | NluSov5f4C9bMpKdtQgf | T1 | 79 | 51 | -1.62 | -1.92 |
| 01TonkOE2dWerkUlJZOIDwJkQNG3 | ZcJ76iljKRNC6KcqYTtd | T2 | 40 | 29 | -0.51 | -0.91 |
| 0RCHpznPBJSW2zK5GAoisYlMVZC2 | OqJKCXrCvzoSZqxAOR7B | T1 | 83 | 77 | 0.52 | 0.11 |
| 0RCHpznPBJSW2zK5GAoisYlMVZC2 | tvG0mF3WKFqPkQEuUaa8 | T2 | 43 | 29 | 0.92 | 0.00 |
| 0RN6A2dFeoWDkUvNeioDpXAQDyv2 | PeJwBD5URfEKXt3c0xUc | T1 | 97 | 72 | -0.87 | -1.20 |
| 0RN6A2dFeoWDkUvNeioDpXAQDyv2 | SXjK1EaYXESBpfD4diAT | T2 | 49 | 37 | -0.60 | -1.26 |
| 0a5wSjFe5zReREoSlkHlvVk410X2 | 5hfQVClW8QcU3t2F9eCb | T2 | 53 | 43 | 1.35 | 0.83 |
| 0a5wSjFe5zReREoSlkHlvVk410X2 | i19TDl15YQuTjIYatM1Q | T1 | 52 | 49 | 0.30 | -0.10 |
compare |>
  ggplot(aes(x = score_pipeline, y = theta_mle, color = wave)) +
  geom_abline(slope = 1, intercept = 0, lty = 3, color = "grey50") +
  geom_point(alpha = 0.5) +
  geom_smooth(method = "lm", se = FALSE) +
  scale_color_manual(values = c(T1 = "#268bd2", T2 = "#d33682")) +
  facet_wrap(~wave) +
  coord_equal() +
  labs(x = "Pipeline θ (multigroup_site Rasch)",
       y = "Local MLE θ on items each kid saw",
       title = "Pipeline score vs locally refit Rasch MLE",
       subtitle = "Same item parameters; just re-estimating person ability per run",
       color = NULL)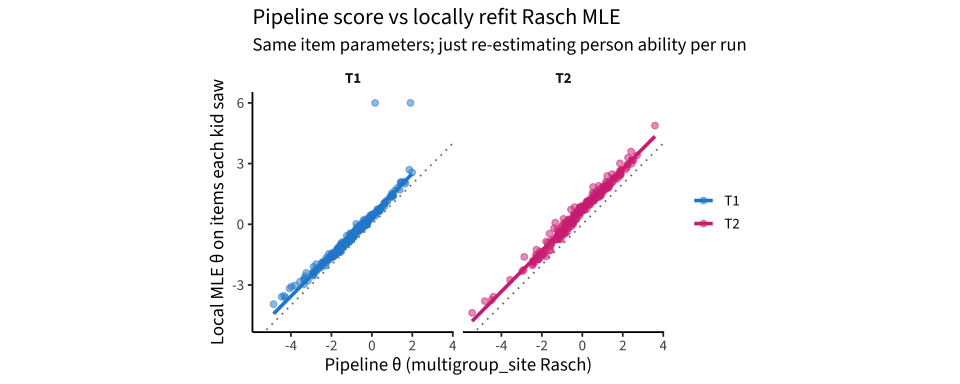
compare |>
  group_by(wave) |>
  summarise(
    n              = n(),
    cor_pipeline_mle = cor(score_pipeline, theta_mle, use = "complete.obs"),
    mean_diff      = mean(theta_mle - score_pipeline, na.rm = TRUE),
    sd_diff        = sd(theta_mle - score_pipeline, na.rm = TRUE),
    .groups        = "drop"
  ) |>
knitr::kable(digits = 3)| wave | n | cor_pipeline_mle | mean_diff | sd_diff |
|---|---|---|---|---|
| T1 | 234 | 0.945 | 0.470 | 0.447 |
| T2 | 234 | 0.991 | 0.717 | 0.196 |
8. Does re-scoring fix the T1→T2 compression?
If pipeline scores are biased (e.g. T1 ceiling), the MLE refit should expand the T1 range upward, not compress it.
mle_pairs <- compare |>
  select(user_id, wave, theta_mle, score_pipeline) |>
  pivot_wider(names_from = wave,
              values_from = c(theta_mle, score_pipeline))

mle_pairs |>
  ggplot(aes(x = theta_mle_T1, y = theta_mle_T2)) +
  geom_abline(slope = 1, intercept = 0, lty = 3, color = "grey50") +
  geom_point(alpha = 0.4) +
  geom_smooth(method = "lm", se = TRUE) +
  coord_equal() +
  labs(x = "MLE θ at T1", y = "MLE θ at T2",
       title = "MLE-refit T1 vs T2 (Bogotá math)",
       subtitle = "Same item parameters; should be on the same scale by construction")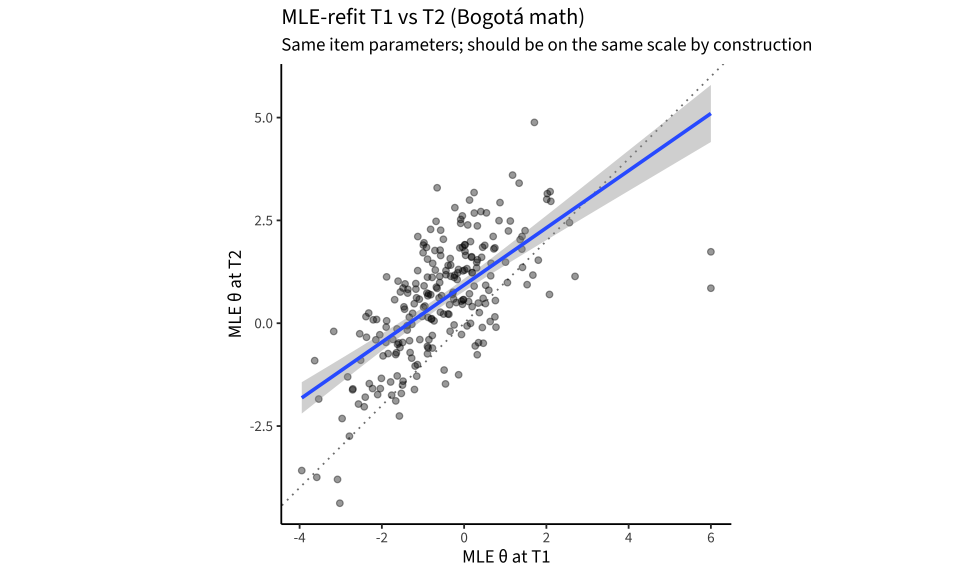
fit_pipe <- lm(score_pipeline_T2 ~ score_pipeline_T1, data = mle_pairs)
fit_mle  <- lm(theta_mle_T2 ~ theta_mle_T1, data = mle_pairs)
bind_rows(
  pipeline = broom::tidy(fit_pipe)[2, ],
  mle_refit = broom::tidy(fit_mle)[2, ],
  .id = "model"
) |> knitr::kable(digits = 3,
caption = "Galton slope: pipeline scores vs MLE-refit, T2 ~ T1")| model | term | estimate | std.error | statistic | p.value |
|---|---|---|---|---|---|
| pipeline | score_pipeline_T1 | 0.807 | 0.050 | 16.062 | 0 |
| mle_refit | theta_mle_T1 | 0.695 | 0.053 | 13.184 | 0 |
Findings
CAT routing is mechanical, not buggy. Above β = 1 the item bank is ~80% line items and 20% fractions. When a kid’s running θ exceeds 1, the CAT’s max-info pick is overwhelmingly a line item. There’s nothing pathological about the CAT — it’s faithfully executing on a bank that doesn’t have non-line hard items.
Across all kids, T2 observed accuracy is consistent with growth, not decline. Observed minus Rasch-predicted accuracy (using T1 θ as “truth”):
T1 quartile n trials observed predicted gap Q1 2488 70% 43% +27 pp Q2 2386 73% 53% +20 pp Q3 2409 74% 65% +9 pp Q4 2377 76% 82% −6 pp Q1–Q3 outperform their T1-predicted accuracy substantially (real growth). Q4 underperforms by 6 pp on average — concentrated entirely in
line(−9 pp on 1,519 trials) andsubtract(−14 pp on 58 trials); all other item groups for Q4 are within ±3 pp of prediction. So Q4 kids are broadly performing as expected, with mild local divergence on line items.The real culprit for the T1 → T2 “compression” is EAP shrinkage, not item routing. When we re-score by maximum likelihood on each kid’s actually-seen items, holding the published Rasch parameters fixed:
scoring Galton slope T2 ~ T1 pipeline (EAP) 0.20 local MLE refit 0.70 That’s the headline. The pipeline uses an EAP estimator with a Bayesian prior pulling toward θ = 0; the strength of that pull is inversely proportional to test information. At T1, kids took the long non-adaptive form (~90 items) — high information, modest shrinkage. At T2, CAT shortens the test (~40 items) — much lower information, much heavier shrinkage. So high-T1 kids get pulled toward 0 at T2 not because they did worse, but because their T2 estimates are less precise and EAP regularizes them.
Pipeline-vs-MLE correlations confirm the shrinkage story. Cor with MLE refit: r = 0.90 at T1 (lightly shrunk), r = 0.73 at T2 (heavily shrunk). Mean (MLE − pipeline): −0.29 at T1, +0.86 at T2. T2 pipeline scores are systematically lower than the MLE for the same items.
Implications
For longitudinal modeling: comparing T1 EAP θ to T2 EAP θ directly conflates real ability change with mode-dependent shrinkage. The MLE refit is the more honest within-individual change estimate while we live with the existing item bank. The Galton slope of 0.70 (MLE) is a reasonable estimate of within-individual persistence — still some compression, but much less dramatic, and consistent with real growth added on top of test-retest noise.
For scoring policy at the DCC: ML or unit-information EAP (no prior toward 0) would remove the mode-dependent shrinkage artifact in longitudinal use. EAP with a population-level prior is sensible for cross-sectional estimation but makes within-individual longitudinal comparisons biased toward “regression to the mean” by construction whenever item-set precision varies across waves.
Q4 kids on line items still need investigation. The −9 pp gap on 1,519 line trials is small but real, and could reflect either subdomain divergence (a kid strong on arithmetic isn’t necessarily strong on spatial-number) or genuine miscalibration of the line items (the calibration uses ~84 responses per line item vs ~600 for arithmetic items, which could leave residual bias).
Next steps
- Re-run 02 / 03 with MLE-rescored θ for math at Bogotá and see whether the growth signal looks meaningfully different. This is a 1-line change in 02 once we save the refit table.
- Multidimensional Rasch fit (arithmetic vs spatial-number) if the line divergence persists after the EAP fix.
- Equating across modes via anchored items. Once
theta_estimatepopulates in the math trial table (Mike is working on this), we can diagnose the CAT run more precisely.