The code and prose in this chapter were written by Claude Code (an AI coding agent) under human direction. They have not been line-by-line verified by a human and must not be published or cited as-is.
These are exploratory analyses of preliminary, in-progress LEVANTE data. Results have not been reviewed or validated and require checking by the LEVANTE Data Coordinating Center before any use.
Purpose
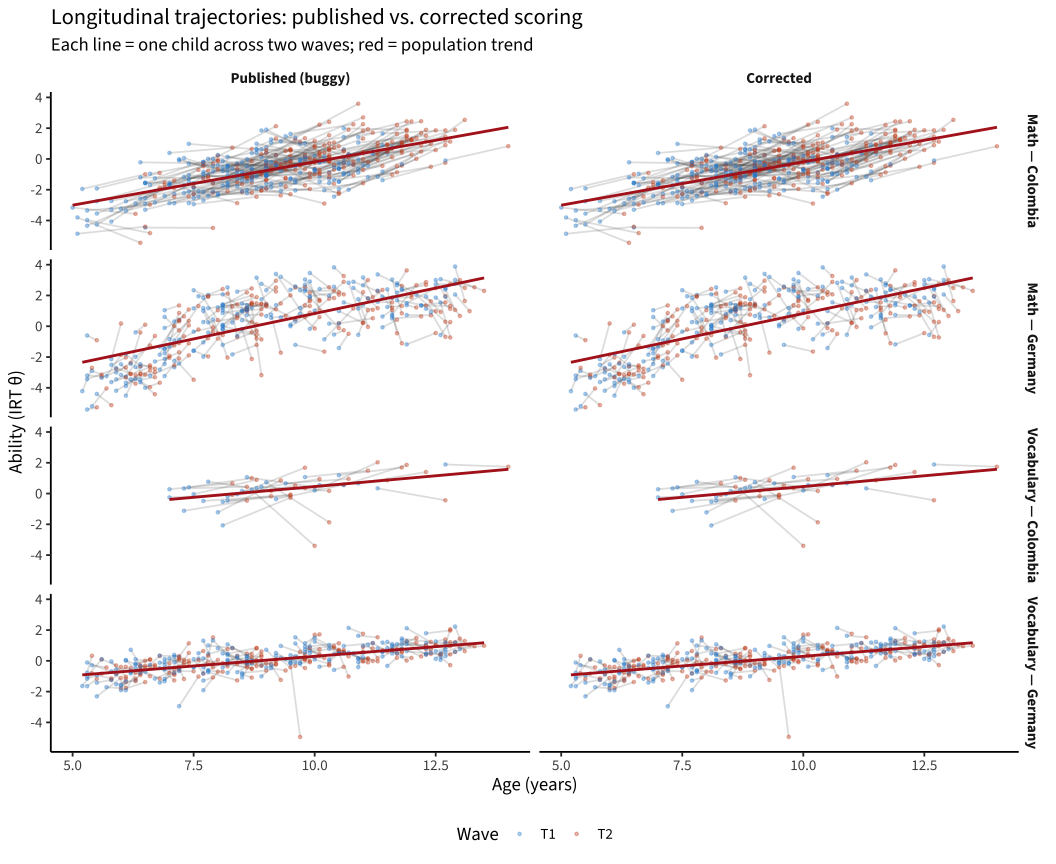
Presentation-ready before/after longitudinal trajectories for the two tasks and two sites where the column-order scoring bug mattered most. “Published” = the scores currently in levante_data_latest (buggy). “Corrected” = rescored with the column-order fix, using the same v1_14 IRT models and the same EAP estimator the pipeline uses (so this previews what the re-run pipeline will produce; WLE looks essentially identical — see tasks/math_item_calibration and the EAP/WLE checks).
High-res PNGs are written to figures/ for slides.
Code
source (here:: here ("common.R" ))library (rlevante)library (mirt)library (patchwork)<- here:: here ("figures" ); fs:: dir_create (fig_dir)<- read_rds (here:: here ("data" , "scores_all_sites.rds" ))<- tribble (~ task_id, ~ tk, ~ dataset, ~ site, ~ model_file,"egma-math" , "math" , "pilot_uniandes_co_bogota" , "Colombia" , "math_model_record_v1_14.rds" ,"egma-math" , "math" , "pilot_mpieva_de_main" , "Germany" , "math_model_record_v1_14.rds" ,"vocab" , "vocab" , "pilot_uniandes_co_bogota" , "Colombia" , "vocab_model_co_v1_14.rds" ,"vocab" , "vocab" , "pilot_mpieva_de_main" , "Germany" , "vocab_model_de_v1_14.rds"
Code
<- function (task_id, tk, dataset, model_file, ...) {<- read_rds (here:: here ("data" , model_file))<- load_levante_trials (task_ids = task_id) |> filter (dataset == !! dataset)score_with_method (tr, tk, dataset, method = "EAP" , mod_rec = mod_rec) |> transmute (run_id, score_corrected = score)<- cells |> mutate (scored = pmap (cells, rescore_cell)) |> select (task_id, dataset, scored) |> unnest (scored)# Assemble: published (buggy) + corrected, with age/wave per run <- scores |> filter (task_id %in% cells$ task_id, dataset %in% cells$ dataset) |> select (run_id, user_id, age, task_id, task_label, dataset,score_published = score) |> inner_join (cells |> distinct (task_id, dataset, site),by = c ("task_id" , "dataset" )) |> left_join (corrected, by = c ("run_id" , "task_id" , "dataset" )) |> group_by (task_id, dataset, user_id) |> arrange (age) |> mutate (wave = row_number ()) |> ungroup () |> filter (wave <= 2 )# keep only kids with two waves <- traj |> group_by (task_id, dataset, user_id) |> filter (n_distinct (wave) == 2 ) |> ungroup () |> mutate (cell = paste0 (task_label, " — " , site))
Before / after trajectories (age on x)
Code
<- two_wave |> pivot_longer (c (score_published, score_corrected),names_to = "scoring" , values_to = "theta" ) |> mutate (scoring = recode (scoring,score_published = "Published (buggy)" ,score_corrected = "Corrected" ) |> factor (levels = c ("Published (buggy)" , "Corrected" )),theta = pmin (pmax (theta, - 6 ), 6 ))<- ggplot (plot_long, aes (x = age, y = theta)) + geom_line (aes (group = user_id), alpha = 0.18 , color = "grey30" ) + geom_point (aes (color = factor (wave)), alpha = 0.35 , size = 0.8 ) + geom_smooth (method = "lm" , se = FALSE , color = "firebrick" , linewidth = 1 ) + facet_grid (cell ~ scoring) + scale_color_manual (values = c (` 1 ` = "#268bd2" , ` 2 ` = "#cb4b16" ),name = "Wave" , labels = c ("T1" , "T2" )) + labs (x = "Age (years)" , y = "Ability (IRT θ)" ,title = "Longitudinal trajectories: published vs. corrected scoring" ,subtitle = "Each line = one child across two waves; red = population trend" ) + theme (legend.position = "bottom" )
Code
ggsave (file.path (fig_dir, "trajectories_before_after.png" ), p_traj,width = 11 , height = 9 , dpi = 300 , bg = "white" )
T1 vs T2 scatter (the compression, before/after)
Code
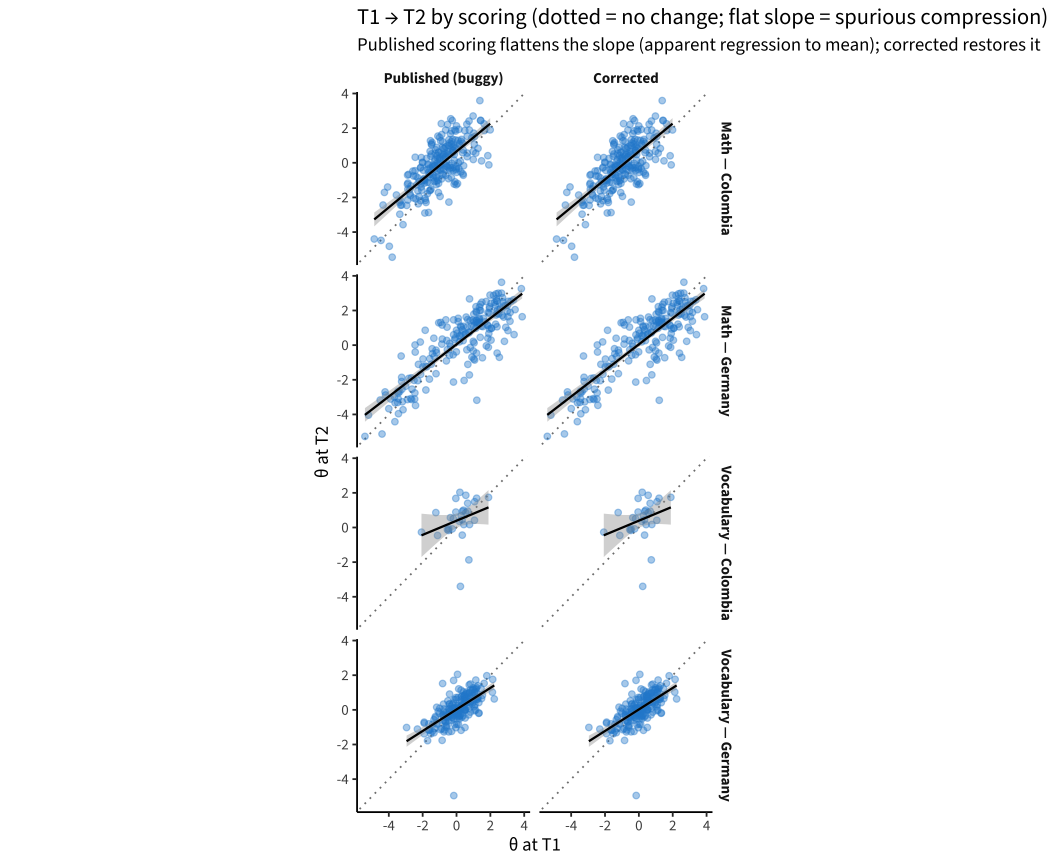
<- two_wave |> select (cell, user_id, wave, score_published, score_corrected) |> pivot_longer (c (score_published, score_corrected),names_to = "scoring" , values_to = "theta" ) |> mutate (scoring = recode (scoring, score_published = "Published (buggy)" ,score_corrected = "Corrected" )) |> pivot_wider (names_from = wave, values_from = theta, names_prefix = "t" ) |> mutate (scoring = factor (scoring, levels = c ("Published (buggy)" , "Corrected" )),t1 = pmin (pmax (t1, - 6 ), 6 ), t2 = pmin (pmax (t2, - 6 ), 6 ))<- ggplot (pairs, aes (x = t1, y = t2)) + geom_abline (slope = 1 , intercept = 0 , lty = 3 , color = "grey50" ) + geom_point (alpha = 0.4 , color = "#268bd2" ) + geom_smooth (method = "lm" , se = TRUE , color = "black" , linewidth = 0.8 ) + facet_grid (cell ~ scoring) + coord_equal () + labs (x = "θ at T1" , y = "θ at T2" ,title = "T1 → T2 by scoring (dotted = no change; flat slope = spurious compression)" ,subtitle = "Published scoring flattens the slope (apparent regression to mean); corrected restores it" ) + theme (aspect.ratio = 1 )
Code
ggsave (file.path (fig_dir, "t1_t2_scatter_before_after.png" ), p_scatter,width = 11 , height = 9 , dpi = 300 , bg = "white" )
Summary table
Code
|> group_by (cell, scoring) |> summarise (n = n (),mean_change = mean (t2 - t1, na.rm = TRUE ),galton_slope = coef (lm (t2 ~ t1))[2 ],.groups = "drop" ) |> pivot_wider (names_from = scoring,values_from = c (n, mean_change, galton_slope)) |> :: kable (digits = 2 )
Math — Colombia
234
234
0.85
0.85
0.81
0.81
Math — Germany
200
200
-0.01
-0.01
0.75
0.75
Vocabulary — Colombia
30
30
0.29
0.29
0.41
0.41
Vocabulary — Germany
202
202
0.00
0.00
0.62
0.62
Code
write_rds (two_wave, here:: here ("data" , "corrected_trajectories_long.rds" ))
Figures saved to figures/trajectories_before_after.png and figures/t1_t2_scatter_before_after.png.