04 — Construct structure: emergent dimensions, differentiation, and the role of g
ImportantAI-generated — not for publication
The code and prose in this chapter were written by Claude Code (an AI coding agent) under human direction. They have not been line-by-line verified by a human and must not be published or cited as-is.
WarningPreliminary & unvetted analysis
These are exploratory analyses of preliminary, in-progress LEVANTE data. Results have not been reviewed or validated and require checking by the LEVANTE Data Coordinating Center before any use.
The question
03 found the core tasks resolve into a strong general factor with only weakly-separable domains. Here we interrogate the construct structure with the full measure set — treating ROAR (reading: word/sentence/phoneme) and MEFS (executive function) as real measures of the underlying structure, not just external validators. They are not LEVANTE innovations, but they are valid measures that help reveal the true dimensional structure.
Plan:
Emergent structure (ESEM) — what dimensions do the data prefer, with all 13 measures and cross-loadings allowed?
Developmental differentiation — how do the factor correlations change with age, under both the theory-driven structure and the emergent structure (local SEM)?
A shared-speed (method) artifact? — does general response speed account for the cross-task covariation?
Pooled cross-sectional sample (first observation per child, four data-rich sites): N = 2161 total; 278 with MEFS, 1491 with ROAR-Word. Reading and MEFS enter as first-class measures alongside the nine core tasks.
1. Emergent structure (ESEM, 13 measures)
Code
R <-lavCor(xw |>select(all_of(vars13)), missing ="fiml"); N <-nrow(xw)map_dfr(1:5, function(nf){ f <-suppressWarnings(fa(R, nfactors = nf, n.obs = N, fm ="ml", rotate ="oblimin"))tibble(factors = nf, RMSEA = f$RMSEA[1], TLI = f$TLI, BIC = f$BIC)}) |> knitr::kable(digits =3, caption ="EFA fit by number of factors (FIML correlation, 13 measures)")
EFA fit by number of factors (FIML correlation, 13 measures)
Two correlated dimensions (r ≈ 0.67) emerge. They map onto a broad fluid / nonverbal factor (matrix, mrot, the memory tasks sds & mg, MEFS) and a verbal / literacy factor (vocab, ToM, the ROAR reading measures), with math split between them. The placement of the new measures is exactly as theory would predict — MEFS lands on the fluid side (.59) and all three ROAR reading measures on the verbal/literacy side (.49–.84) — so they sharpen rather than disrupt the two-factor picture.
The rotation is not perfectly clean, though, and the messiness is informative: TROG (grammar) loads with the fluid cluster (.69) and Hearts & Flowers with the literacy cluster (.54). There is no separate EF factor — the four EF-ish tasks (hf, sds, mg, MEFS) scatter across both dimensions rather than cohering. This cross-domain bleed is the signature of a strong positive manifold: with so much shared general variance, a two-factor rotation recovers a verbal-vs-nonverbal split rather than the reasoning/EF/language theory. (BIC keeps improving past two factors, but the extra factors are small and measure-specific.)
2. Developmental differentiation
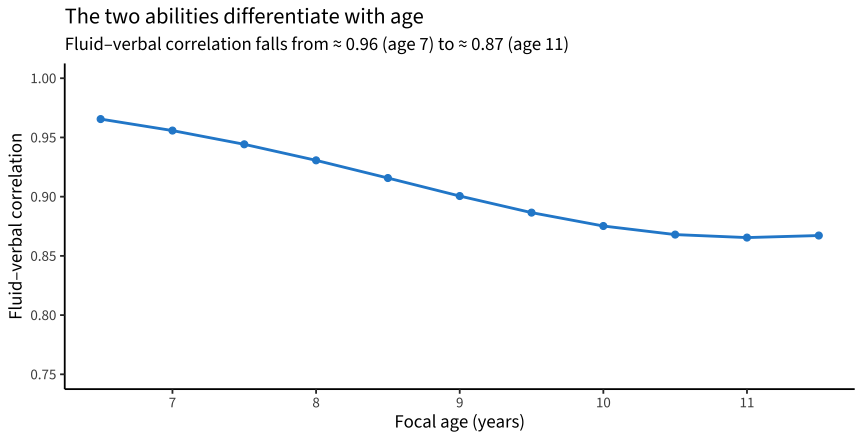
03 selected a two-factor structure (fluid / verbal) as the parsimony-preferred, proper model, so we carry just that forward — here on the full measure set, with MEFS in fluid and the ROAR reading tasks in verbal. We track the fluid–verbal correlation as a smooth function of age (kernel-weighted local SEM, bandwidth 1.5 yr): if the two abilities differentiate, it should fall with age.
Code
emergent2 <-"fluid =~ matrix + mrot + math + hf + mg + sds + mefs verbal =~ trog + vocab + tom + swr + sre + pa"losem_cor <-function(model, pairs, ages =seq(6.5, 11.5, by =0.5), h =1.5) {map_dfr(ages, function(a0) { w <-dnorm((xw$age - a0) / h) fit <-tryCatch(cfa(model, cbind(xw, .w = w), std.lv =TRUE, missing ="fiml",sampling.weights =".w"), error =function(e) NULL)if (is.null(fit) ||!lavInspect(fit, "converged")) return(NULL) cc <-lavInspect(fit, "cor.lv")bind_cols(focal_age = a0,map_dfr(pairs, ~tibble(pair =paste(.x, collapse="–"), r = cc[.x[1], .x[2]]))) })}ld_emerg <-losem_cor(emergent2, list(c("fluid","verbal")))
Code
ld_emerg |>ggplot(aes(focal_age, r)) +geom_line(linewidth =1, color ="#268bd2") +geom_point(size =2, color ="#268bd2") +scale_x_continuous(breaks =7:11) +coord_cartesian(ylim =c(0.75, 1)) +labs(x ="Focal age (years)", y ="Fluid–verbal correlation",title ="The two abilities differentiate with age",subtitle ="Fluid–verbal correlation falls from ≈ 0.96 (age 7) to ≈ 0.87 (age 11)")
The fluid and verbal abilities differentiate with age: their correlation falls from ≈ 0.96 at age 7 to ≈ 0.87 at age 11 (June render: 0.93 → 0.83 — the 2026-08 rural addition raises the overall level of integration but leaves the decline intact). So even the two broad, heavily-correlated dimensions pull apart as children get older — the developmental de-correlation (Spearman’s “law of diminishing returns”) is visible at the coarsest level of structure. And per 03 this is structural, not measurement drift: loadings stay ~age-invariant (metric ΔCFI ≈ −0.01) while the factor correlation changes.
Does it replicate across sites?
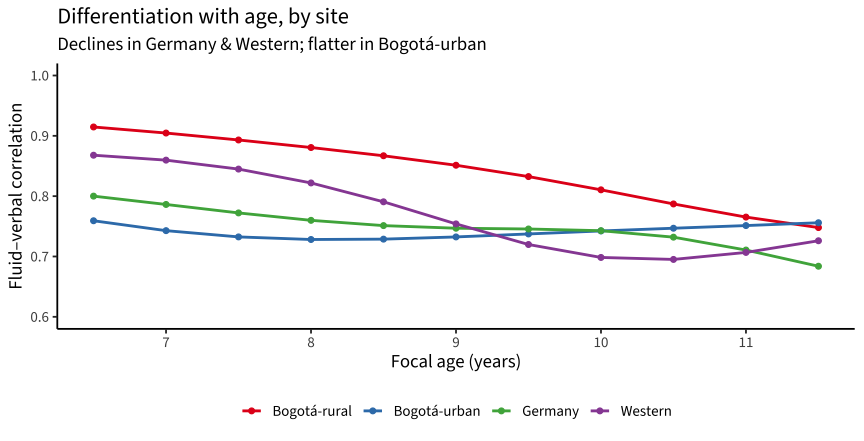
For cross-site comparability we use a core 8-task 2-factor (fluid = matrix / mrot / math / H&F / memory; verbal = TROG / vocab / ToM) — dropping Same-&-Different (sparse adaptive coverage in age-split subsamples) and the MEFS / ROAR measures (coverage varies by site). We compare the fluid–verbal correlation in younger vs older children at each site, and trace it continuously by site (local SEM).
xws |>group_by(site) |>group_modify(function(d, ...){ md <-median(d$age)tibble(n =nrow(d), younger =fv(filter(d, age < md)), older =fv(filter(d, age >= md))) }) |>ungroup() |>mutate(differentiation = younger - older, across(c(younger, older, differentiation), \(x) round(x, 3))) |> knitr::kable(caption ="Fluid–verbal correlation younger vs older, by site (split at site median age)")
Fluid–verbal correlation younger vs older, by site (split at site median age)
site
n
younger
older
differentiation
Bogotá-rural
897
0.904
0.752
0.152
Bogotá-urban
635
0.764
0.693
0.071
Germany
349
0.774
0.718
0.056
Western
280
0.821
0.708
0.113
Code
losem_site <-function(d, ages =seq(6.5, 11.5, .5), h =1.5) map_dfr(ages, function(a0){ w <-dnorm((d$age - a0)/h) f <-suppressWarnings(tryCatch(cfa(m8, cbind(d, .w = w), std.lv =TRUE, missing ="fiml", sampling.weights =".w"), error =function(e) NULL))if (is.null(f) ||!lavInspect(f, "converged")) return(NULL)tibble(focal_age = a0, r =lavInspect(f, "cor.lv")["fluid","verbal"]) })xws |>group_by(site) |>group_modify(~losem_site(.x)) |>ungroup() |>ggplot(aes(focal_age, r, color = site)) +geom_line(linewidth =1) +geom_point(size =1.6) +scale_color_brewer(palette ="Set1", name =NULL) +scale_x_continuous(breaks =7:11) +coord_cartesian(ylim =c(0.6, 1)) +labs(x ="Focal age (years)", y ="Fluid–verbal correlation",title ="Differentiation with age, by site",subtitle ="Declines in Germany & Western; flatter in Bogotá-urban") +theme(legend.position ="bottom")
The differentiation replicates across sites: in every site the younger children show a higher fluid–verbal correlation than the older (differentiation Δ ≈ 0.06–0.16). It is clearest in Bogotá-rural (Δ 0.16) and Western (Δ 0.12), and more modest in Germany (Δ 0.06) and Bogotá-urban (Δ 0.07). The overall correlation sits in a narrow band across sites (≈ 0.83–0.86), so the level of integration is similar everywhere even though the developmental slope varies. (Bogotá-rural’s continuous local SEM didn’t converge across the full age grid — sparse coverage — so it appears in the table but not the curve; its younger/older split confirms the same pattern.)
3. Is the g-loading a shared-speed (method) artifact?
A general response-speed factor (same 4-AFC tablet format) could inflate cross-task covariation. We build a general-speed factor from per-person median log RTs across the 8 timed core tasks (Memory has no RT) and relate it to cognitive g.
A general speed factor exists but is ~orthogonal to ability
metric
value
mean cross-task RT correlation
0.330
cor(cognitive g, slowness)
0.164
A general speed factor exists (RTs correlate ≈ 0.34 across tasks) but is nearly orthogonal to cognitive g (r ≈ 0.15, positive — slower, more deliberate children if anything score slightly higher). The g-loading is not a shared-speed/method artifact.
Synthesis
With ROAR and MEFS included as real measures, the structure sharpens but the big picture is unchanged and now better-anchored:
fused at r ≈ 0.92, flat across all ages; no distinct EF factor in ESEM
External measures behave as theory predicts
MEFS → fluid side (.59); ROAR reading → verbal/literacy side (.49–.84)
Dimensions differentiate with age
fluid–verbal correlation falls 0.96→0.87 (age 7→11, 2026-08 data); structural, not loading drift (03); replicates across sites (Δ 0.06–0.15)
g-loading is substantive
not a site-mean effect (03), not a speed artifact (§3)
The battery, at these ages, measures a strong fluid/executive ability and a separable verbal/literacy ability, with the verbal dimension differentiating from the fluid core as children get older. Adding MEFS and the ROAR measures confirms this two-dimensional picture rather than revealing more domains — and notably, reading relates to the whole structure (g), not just to language (language–reading ≈ reasoning–reading), so even with reading as a first-class measure the differential structure is fluid-vs-verbal, not finer.
Next: a longitudinal second-order model (does g grow; does the fluid/verbal split widen within child over time?) as waves accrue; and bringing MEFS into the cross-language DIF / measurement-invariance work now that it’s a modeled measure.